Transformer-based bias correction & extreme-event calibration for S2S forecasts
A Space-Time Transformer post-processes subseasonal-to-seasonal ensemble forecasts — correcting bias, calibrating spread, and sharpening extremes — benchmarked with ACC, RMSE, CRPS, CRPSS and Brier skill.
Test-set skill
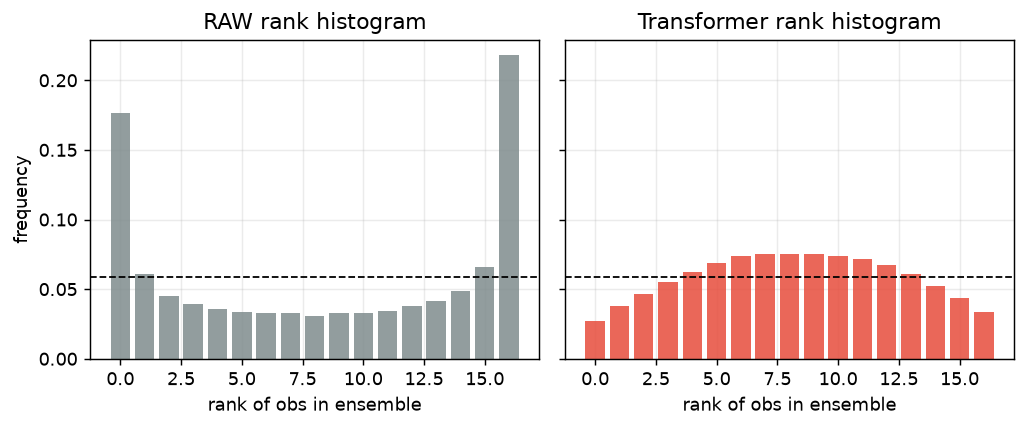
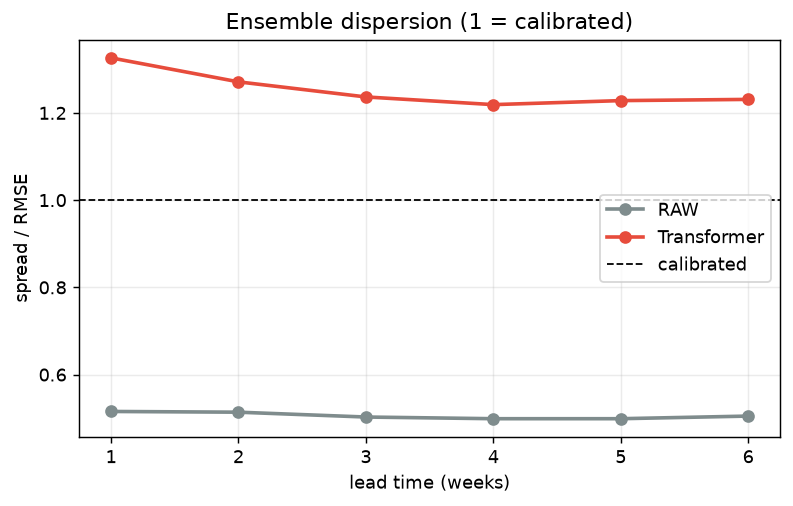
Held-out test set (514-case dataset, 6 lead weeks on a 16×16 grid), evaluated on anomalies. Green = best in column; the transformer row is highlighted. Lower is better for RMSE/CRPS; for spread/err, 1.0 is calibrated.
| method | RMSE (K) | ACC | CRPS (K) | CRPSS vs raw | CRPSS vs clim | spread/err | BSS q90 | BSS q95 | BSS q98 |
|---|---|---|---|---|---|---|---|---|---|
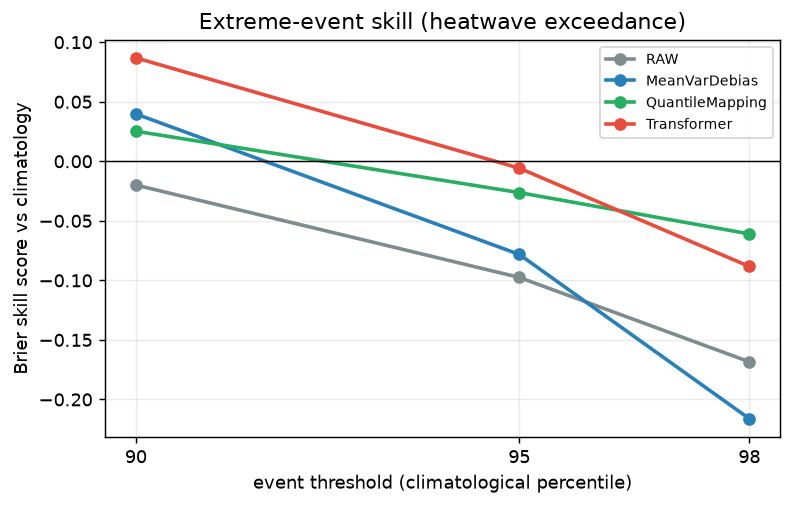
| RAW | 2.510 | +0.582 | 1.468 | +0.000 | +0.084 | 0.504 | -0.020 | -0.098 | -0.168 |
| MeanVarDebias | 2.508 | +0.580 | 1.328 | +0.095 | +0.171 | 1.000 | +0.040 | -0.078 | -0.216 |
| QuantileMapping | 2.426 | +0.616 | 1.426 | +0.028 | +0.110 | 0.526 | +0.025 | -0.026 | -0.061 |
| Transformer | 2.337 | +0.623 | 1.253 | +0.146 | +0.218 | 1.240 | +0.087 | -0.006 | -0.088 |
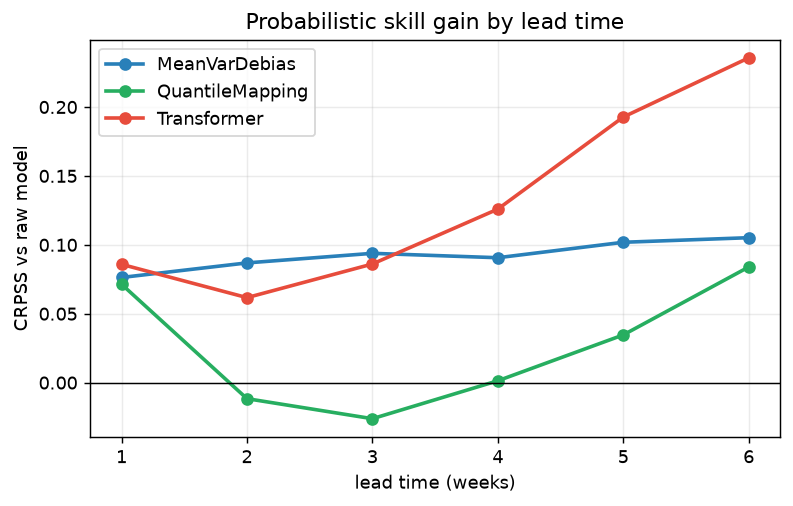
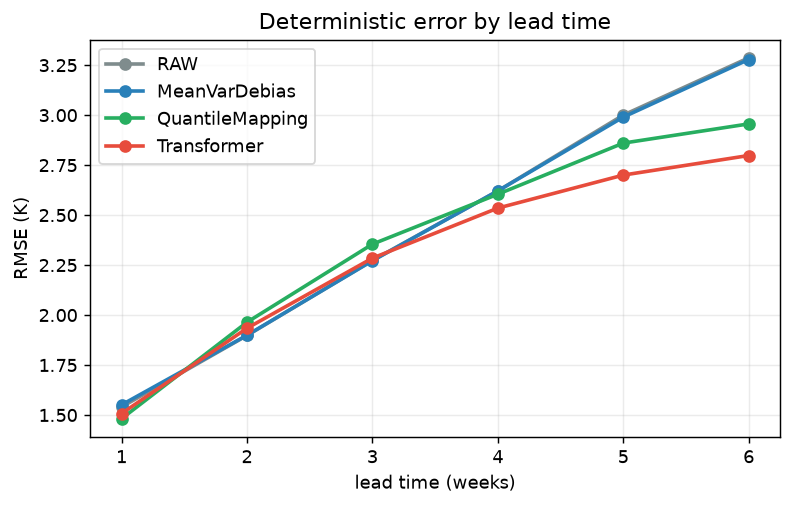
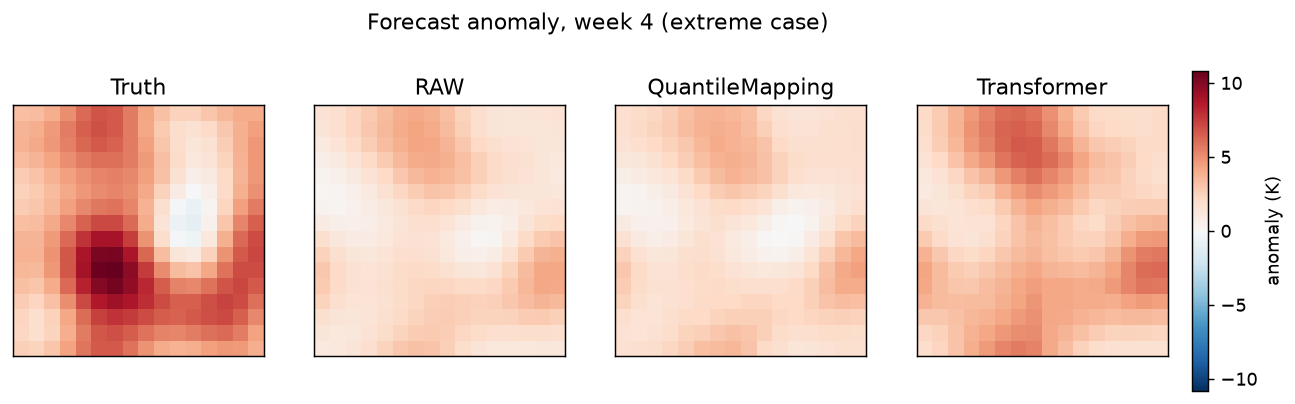
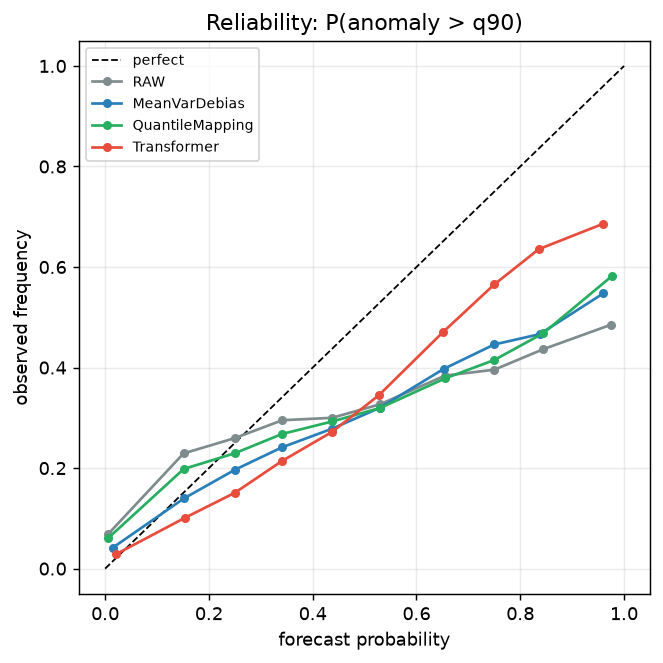
The transformer leads on every aggregate score — deterministic (RMSE, ACC), probabilistic (CRPS, CRPSS) and moderate-extreme (BSS q90). MeanVarDebias fixes dispersion only; QuantileMapping fixes the marginal distribution but not dispersion; the transformer fixes both jointly and conditions on the large-scale state.
Results
Method
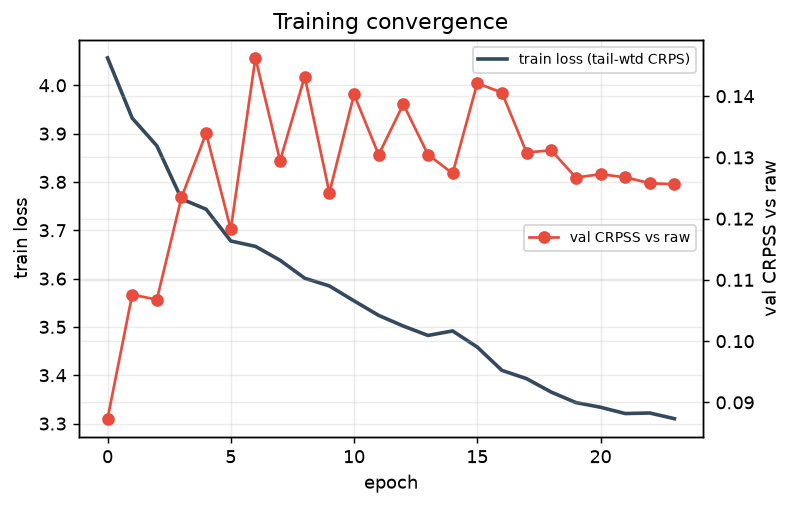
Each forecast case — ensemble-mean and ensemble-spread anomaly fields — is split into spatial patches; every (lead, patch) pair is a token and the model applies full space-time self-attention. The head emits a per-gridpoint mean correction and a per-token spread inflation, trained on a tail-weighted CRPS + mean-anchoring MSE objective. The reference model is implemented in pure NumPy with a hand-written autograd engine (gradient-checked against finite differences); a parity PyTorch version is provided for GPU training on real data.
Reproducibility: the figures and table above are produced on a physically-motivated synthetic S2S dataset so
the pipeline runs anywhere with no downloads. The same code runs on real ERA5 + WeatherBench2 S2S forecasts
(public, anonymous Zarr on Google Cloud) via s2s_bc.data.real.build_real_dataset; the NASA GEOS-S2S path is wired
through the IRI SubX endpoint.